Data Sets
- Alignment Simulations
- Tree Building Simulations
- Fiddler Crab Data
- Human Data
- Other Data
Pairwise Alignment Simulations
These data consist of pairs of sequences simulated under 83 different sets of conditions, 1000 replicates per condition. The full set of conditions and methods are described in the reference below (in particular, see Table 1). For each replicate, there are three files, all in fasta format, representing the true simulated alignment, unalinged gapless sequences, and randomized sequences.
Download Data (224 MB zipped)Related Publications
Multiple Alignment Simulations
These data consist of sets of four sequences simulated under varying branch depths, 1000 replicates per condition. The set of conditions and methods are described in the reference below. All analyses presented in the paper focused on just 3 of the 4 simulated sequences, although results of including the 4th sequence in analyses is mentioned. (Additional replicated conditions focused on the fourth sequence are also included in this data set as part of the unshown results). For each replicate, there is a single file in fasta format, representing the true simulated alignment.
Download Data (291 MB zipped)Related Publications
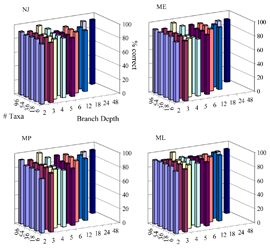
Alignment & Phylogeny Simulations

This data set consists of 15,400 simulated sequence data sets for 16-taxa trees. The simulation consisted of 7 base topologies, each 11 sets of relative branch lenghts which were then scaled to two different evolutionary depths. Every set of these 154 conditions was simulated 100 times. The data contains a nexus data file for each simulated data set which represents the true alignment and site homology. Tree files containing the base phylogenies for each of the 77 sets of topology and relative branch lengths are also included.
Download Data (345 MB zipped)Related Publications
- Rosenberg, M.S. (2005) Multiple sequence alignment accuracy and evolutionary distance estimation. BMC Bioinformatics 6:278.
- Ogden, T.H., and M.S. Rosenberg (2006) Multiple sequence alignment accuracy and phylogenetic inference. Systematic Biology 55(2):314–328.
- Ogden, T.H., and M.S. Rosenberg (2007) How should gaps be treated in parsimony? A comparison of approaches using simulation. Molecular Phylogenetics and Evolution 42(3):817–826.
- Ogden, T.H., and M.S. Rosenberg (2007) Alignment and topological accuracy of the direct optimization approach via POY and traditional phylogenetics via ClustalW + PAUP*. Systematic Biology 56(2):182–193.
- Rosenberg, M.S., and T.H. Ogden (2009) Simulation approaches to evaluating alignment error and methods for comparing alternate alignments. Pp. 179–207 in Sequence Alignment: Methods, Models, Concepts, and Strategies, M.S. Rosenberg, ed. University of California Press: Berkeley, CA.
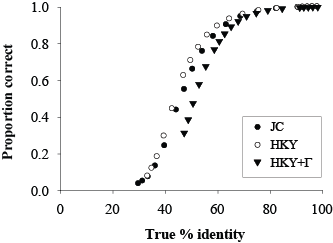
Phylogeny Depth Simulations
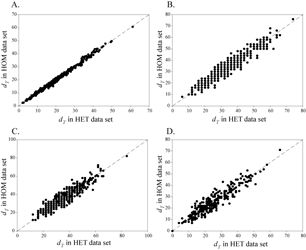
A set of simulations for testing the efficiency of phylogenetic methods at reconstructing deep and shallow relationships. Two nucleotide models were simulated, Jukes-Cantor and HKY. For the JC simulations, parameters included two sequence lengths (200 and 500 bases), 5 different substitution rates, 5 sets of taxon sizes, and 2 different tree topologies per size, for a total of 100 sets of parameters. For the HKY model, parameters included two sequence lengths, 3 different substitution rates, 2 values for the transition/transversion bias, 2 sets of nucleotide frequencies, 3 sets of taxon sizes, and 2 tree topologies per size, for a total of 144 sets of parameters. Each of the 244 sets of parameters was simulated 500 times. The full details and values can be found in the associated paper.
Download Data (571 MB zipped)Related Publications
Taxon Sampling Simulation Data
A set of simulations for testing the effects of taxon sampling on phylogenetic inferencer. There were two large sets of simulation. The first consists of DNA simulations for 50 genes over a 66-taxa mammal tree. The second consists of protein simulations for 1,167 genes over an 18-taxa vertebrate tree. In both cases, 100 replicates were simulated per gene. The original base model tree for each simulation is included, and each replicate has the data stored in NEXUS format. More details of the simulations and analysis can be found in the PNAS paper.
Download Data (327 MB zipped)Related Publications
- Rosenberg, M.S., and S. Kumar (2001) Incomplete taxon sampling is not a problem for phylogenetic inference. Proceedings of the National Academy of Sciences USA 98(19):10751–10756.
- Rosenberg, M.S., and S. Kumar (2003) Taxon sampling, bioinformatics, and phylogenomics. Systematic Biology 52(1):119–124.
Mammalin Gene Family Simulations
These simulations consisted of 448 genes for a 66-taxa mammal tree, with simulation parameters for each gene based on observed properties of each gene family. For every gene, a simulation was conducted with stationary (homogeneous) and nonstationary (heterogeneous) nucleotide frequencies. Each condition was also replicated 100 times, leading to 89,600 simulated data sets. The sequences are stored in NEXUS format. In addition, files describing the model tree, the summary of the simulation parameters for each family, and lists of which taxa were eliminated as part of a nested taxon sampling scheme are included.
These data were used to (1) test the effects of nonstationary nucleotide frequencies on phylogenetic inference and (2) compare concatenation versus consensus methods for combining multiple genes in phylogenetic inference.
Download Data (1.61 GB zipped)Related Publications
- Rosenberg, M.S., and S. Kumar (2003) Heterogeneity of nucleotide frequencies among evolutionary lineages and phylogenetic inference. Molecular Biology and Evolution 20(4):610–621.
- Gadagkar, S.R., M.S. Rosenberg, and S. Kumar (2005) Inferring species phylogenies from multiple genes: Concatenated sequence tree versus consensus gene tree. Journal of Experimental Zoology. B. Molecular and Developmental Evolution 304(1):64–74.
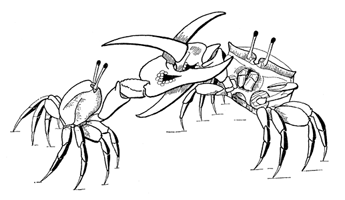
Mud Fiddler Crab (Minuca pugnax) Claw Morphometric Data
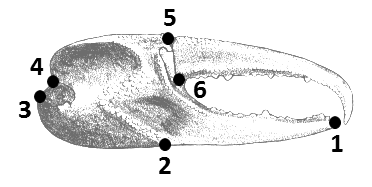
This data set consists of six landmark coordinates for both the major and minor claws of 63 male fiddler crabs of the species Minuca pugnax. The data is in a tab-delimited text file; the landmark descriptions can be found in the associated paper.
Download Data (7.34 KB zipped)Related Publications
- Rosenberg, M.S. (1997) Evolution of shape differences between the major and minor chelipeds of Uca pugnax (Decapoda: Ocypodidae). Journal of Crustacean Biology 17(1):52–59.
- Rosenberg, M.S. (2000) The Comparative Claw Morphology, Phylogeny, and Behavior of Fiddler Crabs (Genus Uca). Ph.D. Thesis. Department of Ecology and Evolution, State University of New York at Stony Brook, Stony Brook, NY.
Fiddler Crab Phylogeny Character Data
The morphological data matrix used to construct a phylogeny of fiddler crabs. Both the descriptions and character matrix were published as appendices in the original paper, but are presented here for easier access. The data matrix is in nexus format.
Download Data (78.6 KB zipped)Related Publications
- Rosenberg, M.S. (2000) The Comparative Claw Morphology, Phylogeny, and Behavior of Fiddler Crabs (Genus Uca). Ph.D. Thesis. Department of Ecology and Evolution, State University of New York at Stony Brook, Stony Brook, NY.
- Rosenberg, M.S. (2001) The systematics and taxonomy of fiddler crabs: A phylogeny of the genus Uca. Journal of Crustacean Biology 21(3):839–869.
Fiddler Crab Claw Morphometric Data
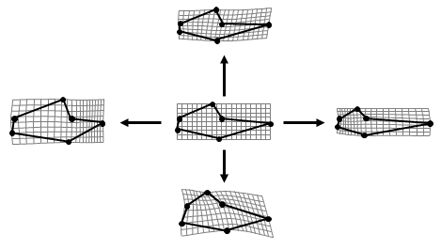
This data set represents claw morphometrics data for males in over 80 species of fiddler crab. Separate data files (TPS format) contain the major and minor claws of each species. Sample sizes range from 1 to 50. Each claw is represented by six landmark characters as well as an outline of the manux and pollex (the articulating dactyl was not included in outline captures). There is also an Excel file with information about each individual crab, including carapace width and whether the individual was left- or right-handed with respect to the major claw.
Download Data (4.71 MB zipped)Related Publications
- Rosenberg, M.S. (2000) The Comparative Claw Morphology, Phylogeny, and Behavior of Fiddler Crabs (Genus Uca). Ph.D. Thesis. Department of Ecology and Evolution, State University of New York at Stony Brook, Stony Brook, NY.
- Rosenberg, M.S. (2002) Fiddler crab claw shape variation: A geometric morphometric analysis across the genus Uca. Biological Journal of the Linnean Society 75(2):147–162.
Fiddler Crab Handedness
This data set consists of a collection of handedness counts for approx. 90 species of fiddler crab. These data were compiled from a number of sources (see data file for complete reference source list) and originally published as an appendex to Mengersen and Schmid (2013).
The data are stored in a tab-delimited text file.
Download Data (3.71 KB zipped)Related Publications
- Mengersen, K., and C.H. Schmid (2013) Maximum likelihood approaches to Meta-analysis. Pp. 125-144 in Handbook of Meta-analysis in Ecology and Evolution, J. Koricheva, J. Gurevitch and K.L. Mengersen, eds. Princeton University Press: Princeton, NJ.
- Schmid, C.H., and K. Mengersen (2013) Bayesian Meta-analysis. Pp. 145-173 in Handbook of Meta-analysis in Ecology and Evolution, J. Koricheva, J. Gurevitch and K.L. Mengersen, eds. Princeton University Press: Princeton, NJ.
Uca princeps photographs

An archived set of the photographs showing Uca princeps in the United States for the first time. Photographer details and links included.
Download Data (2.39 MB zipped)Related Publications
European Ethnohistory Database
This database was created by Robert Sokal and his colleagues over many years (and grants) in the 1980's and early 1990's. While I personally had nothing to do with the construction of the data set, I did work on some of the final analyses at the tail end of the project and had the responsibility of originally making it available on the web in the mid-1990's (where it has continued to persist in obscurity to this day on a website I haven't had access to edit since the early 2000's). Having found all of the original web files, I am providing a download of the primary data here where it may be more readily accessible for the future.
Download Data (2.35 MB zipped)Related Publications
- Sokal, R.R. and J. Friedlaender (1982) Spatial autocorrelation analysis of biological variation on Bougainville Island. Pp. 205-227 in Current Developments in Anthropological Genetics: Population Structure and Ecology. Vol. II, M.H. Crawford and J.H. Mielke, eds. Plenum Publishing Company, New York.
- Sokal, R.R. and P. Menozzi (1982) Spatial autocorrelation of HLA frequencies in Europe support demic diffusion of early farmers. American Naturalist 119:1-17.
- Sokal, R.R. (1984) Spatial analysis in population biology and regional science. Pp. 241-266 in Regional and Industrial Development Theories, Models, and Empirical Evidence, A.E. Andersson, W. Isard, and T. Puu, eds. North-Holland, Amsterdam.
- Sokal, R.R., P.E. Smouse and J.V. Neel (l986) The genetic structure of a tribal population, the Yanomama Indians. XV. Patterns inferred by autocorrelation analysis. Genetics 114:259- 281.
- Sokal, R.R. (1986) Die räumlichen Analyse der menschlichen Populationsstruktur. Homo 37:50-71.
- Winkler, E.-M. and R.R. Sokal (1987) A phenetic classification of Kenyan tribes and subtribes. Human Biology 59:121-145.
- Sokal, R.R. and E.-M. Winkler (1987) Spatial variation among Kenyan tribes and subtribes. Human Biology 59:147-164.
- Sokal, R.R., I.A. Lengyel, P.A. Derish, M.C. Wooten and N.L. Oden (1987) Spatial autocorrelation of ABO serotypes in mediaeval cemeteries as an indicator of ethnic and familial structure. Journal of Archaeological Science 14:615-633.
- Sokal, R.R., H. Uytterschaut, F.W. Rösing and I. Schwidetzky (1987) A classification of European skulls from three time periods. American Journal of Physical Anthropology 74:1-20.
- Sokal, R.R. and H. Uytterschaut (1987) Cranial variation in European populations: A spatial autocorrelation study at three time periods. American Journal of Physical Anthropology 74:21-38.
- Sokal, R.R. (1988) Genetic, geographic, and linguistic distances in Europe. Proceedings of the National Academy of Sciences USA 85:1722-1726.
- Sokal, R.R., N.L. Oden and B.A. Thomson (1988) Genetic changes across language boundaries in Europe. American Journal of Physical Anthropology 76:337-361.
- Derish, P.A. and R.R. Sokal (1988) A classification of European populations based on gene frequencies and cranial measurements: A map-quadrat approach. Human Biology 60:801-824.
- Harding, R.M. and R.R. Sokal (1988) Classification of the European language families by genetic distances. Proceedings of the National Academy of Sciences USA 85:9370-9372.
- Sokal, R.R., N.L. Oden, P. Legendre, M.J. Fortin, J. Kim and A. Vaudor (1989) Genetic differences among language families in Europe. American Journal of Physical Anthropology 79:489-502.
- Sokal, R.R., N.L. Oden, P. Legendre, M.J. Fortin, J.Kim, B.A. Thomson, A. Vaudor, R.M. Harding and G. Barbujani (1990) Genetics and language in European populations. American Naturalist 135:157-175.
- Harding, R.M., F.W. Rösing, and R.R. Sokal (1990) Cranial measurements do not support Neolithization of Europe by demic expansion. Homo 40:45-58.
- Sokal, R.R., R.M. Harding, and N.L. Oden (1989) Spatial patterns of human gene frequencies in Europe. American Journal of Physical Anthropology 80:267-294.
- Sokal, R.R. (1989) Update to Haldane's "Blood-Group Frequencies of European Peoples and Racial Origins". Human Biology 61:691-702.
- Barbujani, G. and R.R. Sokal (1990) Zones of sharp genetic change in Europe are also linguistic boundaries. Proceedings of the National Academy of Sciences USA 87:1816-1819.
- Excoffier, L., R.M. Harding, R.R. Sokal, B. Pellegrini and A. Sanchez-Mazas (1991) Spatial differentiation of Rhesus and Gm haplotype frequencies in sub-Saharan Africa and its relation to linguistic affinities. Human Biology 63:273-308.
- Barbujani, G. and R.R. Sokal (1991) Genetic population structure of Italy. I. Geographical patterns of gene frequencies. Human Biology 63:253-272.
- Barbujani, G. and R.R. Sokal (1991) Genetic population structure of Italy. II. Physical and cultural barriers to gene flow. American Journal of Human Genetics 48:398-411.
- Sokal, R.R. (1991) Ancient movement patterns determine modern genetic variances in Europe. Human Biology 63:589-606.
- Sokal, R.R. (1991) The continental population structure of Europe. Annual Review of Anthropology 20:119-140.
- Livshits, G., R.R. Sokal, and E. Kobylianski (1991) Genetic affinities of Jewish populations. American Journal of Human Genetics 49:131-146.
- Sokal, R.R., N.L. Oden, and C. Wilson (1991) Genetic evidence for the spread of agriculture in Europe by demic diffusion. Nature 351:143-145.
- Sokal, R.R., R.M. Harding, G.W. Lasker, and C.G.N. Mascie-Taylor (1992) A spatial analysis of 100 surnames in England and Wales. Annals of Human Biology 19:445-476.
- Sokal, R.R., N.L. Oden, and B.A. Thomson (1992) Origins of the Indo-Europeans: genetic evidence. Proceedings of the National Academy of Sciences USA 89:7669-7673.
- Sokal, R.R., G.M. Jacquez, N.L. Oden, D. DiGiovanni, A.B. Falsetti, E. McGee, and B.A. Thomson (1993) Genetic relationships of European populations reflect their ethnohistorical affinities. American Journal of Physical Anthropology 91:55-70.
- Sokal, R.R. and G. Livshits (1993) Geographic variation of six dermatoglyphic traits in Eurasia. American Journal of Physical Anthropology 90:393-407.
- Falsetti, A.B. and R.R. Sokal (1993) Genetic structure of human populations in the British Isles. Annals of Human Biology 20:215-229.
- Barbujani, G., R.R. Sokal, and N.L. Oden (1995) Indo-European origins: A computer-simulation test of five hypotheses. American Journal of Physical Anthropology 96:109-132.
- Weng, Z. and R.R. Sokal (1995) Origins of Indo-Europeans and the spread of agriculture in Europe: Comparison of lexicostatistical and genetic evidence. Human Biology 67: 577-594.
- Chen, J., R.R. Sokal, and M. Ruhlen (1995) Worldwide analysis of genetic and linguistic relationships of human populations. Human Biology 67:595-612.
- Sokal, R.R., N.L. Oden, M.S. Rosenberg, and D. DiGiovanni (1997) The patterns of historical population movements in Europe and some of their genetic consequences. American Journal of Human Biology 9(3):391–404.
- Sokal, R.R., N.L. Oden, M.S. Rosenberg, and D. DiGiovanni (1997) Ethnohistory, genetics, and cancer mortality in Europeans. Proceedings of the National Academy of Sciences USA 94(23):12728–12731.
- Rosenberg, M.S., R.R. Sokal, N.L. Oden, and D. DiGiovanni (1999) Spatial autocorrelation of cancer in Western Europe. European Journal of Epidemiology 15(1):15–22.
- Sokal, R.R., N.L. Oden, M.S. Rosenberg, and B.A. Thomson (2000) Cancer incidences in Europe related to mortalities, and ethnohistoric, genetic, and geographic distances. Proceedings of the National Academy of Sciences USA 97(11):6067–6072.
- Sokal, R.R., N.L. Oden, M.S. Rosenberg, and B.A. Thomson (2004) A new protocol for evaluating putative causes for multiple variables in a spatial setting, illustrated by its application to European cancer rates. American Journal of Human Biology 16(1):1–16.
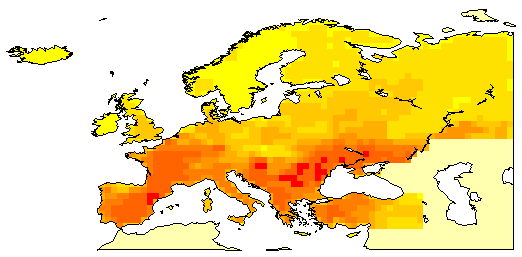
European Cancer Mortality Rates
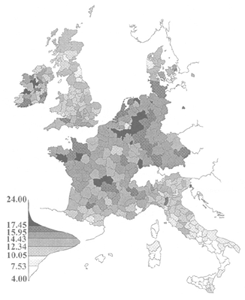
These files represent mortality due to cancer in different parts of Europe in the late 20th century.
The Western European data represents mortality for 40 sex-specific cancers for 355 cancer registration districts in the European Economic Union in the 1970's. The data was extracted from Smans, M., C.S. Muir, and P. Boyle, eds. (1992) Atlas of Cancer Mortality in the European Economic Community. IARC Scientific Publ. No. 107.
The Eastern European data represents mortality for 32 sex-specific cancers for 194 cancer registration districts from eastern and central Europe in the 1980's. Mortality data for an additional 4 sex-specific cancers are available for 153 of the districts (all locations from the full data set except those found in Romania). These data were extracted from Zatonski, W., M. Smans, J. Tyczynski, and P. Boyle, eds. (1996) Atlas of Cancer Mortality in Central Europe. IARC Scientific Publ. No. 134.
In addition to the mortality rates, the data has been appended with the latitude and longitude of each district.
The data are stored in tab-delimited text files.
Download Data (36.8 KB zipped)Related Publications
- Sokal, R.R., N.L. Oden, M.S. Rosenberg, and D. DiGiovanni (1997) Ethnohistory, genetics, and cancer mortality in Europeans. Proceedings of the National Academy of Sciences USA 94(23):12728–12731.
- Rosenberg, M.S., R.R. Sokal, N.L. Oden, and D. DiGiovanni (1999) Spatial autocorrelation of cancer in Western Europe. European Journal of Epidemiology 15(1):15–22.
- Sokal, R.R., N.L. Oden, M.S. Rosenberg, and B.A. Thomson (2000) Cancer incidences in Europe related to mortalities, and ethnohistoric, genetic, and geographic distances. Proceedings of the National Academy of Sciences USA 97(11):6067–6072.
- Rosenberg, M.S. (2000) The bearing correlogram: A new method of analyzing directional spatial autocorrelation. Geographical Analysis 32(3):267–278.
- Sokal, R.R., N.L. Oden, M.S. Rosenberg, and B.A. Thomson (2004) A new protocol for evaluating putative causes for multiple variables in a spatial setting, illustrated by its application to European cancer rates. American Journal of Human Biology 16(1):1–16.
Palenque Bird Extinction Data
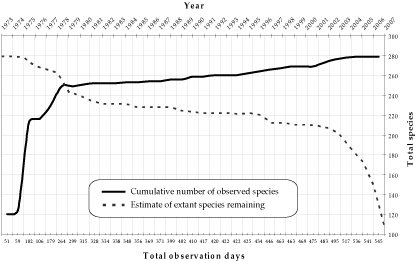
This data set consists of three supplemental files, the second of which is the base data of the study. (1) A list of all contributors to the Rio Palenque Science Center bird list. (2) An Excel file containing the bird observation list, including first and last year observed and a series of life history and related characters for each of 277 species. (3) Appendix S1: Descriptions of the criteria for hypothesis tests found in Table 1 of the paper.
Download Data (46.5 KB zipped)